By Brett Zollinger
Fort Hays State University
Shala Mills
State University of New York at New Paltz
Emily Brandt and Wendy Rohleder-Sook
Fort Hays State University
Abstract
Recognition of food insecurity among college students in the U.S. is growing. With college costs outpacing inflation for many years now, to what extent do students at “affordable” public-supported state universities experience difficulty affording food throughout the academic year? This article highlights the level of food insecurity among students enrolled in on-campus courses at Fort Hays State University. A two-wave, self-administered mail survey found that 34% of on-campus students experienced food insecurity in the previous year, and those who were food insecure were much more likely to use local food supports, including a campus food pantry. Current combined household income was the strongest correlate of food insecurity, and a number of other sociodemographic characteristics were not associated with being food insecure. In addition, the lower the reliance on savings among sources used to pay for college costs, the more likely a student was to be food insecure. The article concludes with a discussion of implications for local programming.
Keywords
college student hunger, college student food insecurity, correlates food insecurity, college student use food supports
Author Note
Brett Zollinger, Department of Sociology, Fort Hays State University; Shala Mills, Office of Graduate and Extended Learning, State University of New York at New Paltz; Emily Brandt, Department of Political Science, Fort Hays State University; Wendy Rohleder-Sook, Financial Assistance Office, Fort Hays State University.
Correspondence regarding this article should be addressed to Brett Zollinger, Chair, Department of Sociology, Fort Hays State University, Rarick Hall 354, 600 Park Street, Hays, KS 67601. Phone: (785) 628-5881. E-mail: bazollinger@fhsu.edu
Food Insecurity on College Campuses
A growing number of students entering college are low-income, Pell-grant recipients (College Board, 2017) who face many barriers to success at the postsecondary level. These immediate setbacks are coupled with rising tuition and fees at a rate four times higher than the rate of inflation during the last 30 years (Duke-Benfield, 2015, p. 1). Over the past several years, considerable national attention has turned to the increasing financial pressures faced by college students in the United States. Myriad articles have discussed the rising costs of attending college and the growing debt incurred by students who borrow to pay for their education. More recently, this attention (e.g., Goldrick-Rab, 2018; Krishnamurthy, 2018; Smola, 2018) has begun to focus on a particular area that highlights the serious toll financial burdens can take on college students: food insecurity. In 2016, the U.S. Department of Agriculture (USDA) (2018a) reported that 12.3% of individuals in the United States were food insecure; however, current research, as we will detail later in this article, has indicated that college students are well over 12.3% food insecure.
The USDA (2018b) defines food insecurity as “a household-level economic and social condition of limited or uncertain access to adequate food.” This access is limited by a lack of money and other resources. Food insecurity is also characterized by an inability to acquire nutritionally adequate and safe foods, and an inability to acquire acceptable food in socially acceptable ways (i.e., the individual resorts to scavenging, stealing, or other strategies to obtain food) (USDA, 2017). Conversely, food-secure individuals have access at all times to enough food for an active, healthy life. In addition, lack of culturally appropriate foods represents another consideration regarding food insecurity, as immigrants rely increasingly upon food-support networks, which comprise nonprofits, businesses, or government entities whose primary objective is to mitigate food insecurity (Bazerghi, McKay, & Dunn, 2016).
The National Survey of Student Engagement (NSSE) collects data from four-year colleges and universities. NSSE’s 2015 data revealed that “more than half of students—freshman and seniors alike—said they were worried about paying for college…. Sixty percent of students said they were worried about having enough money for regular expenses” (New, 2015). In its “Hunger in America 2014: Executive Summary,” Feeding America reported that 10% of the organization’s adult clients were current students and that “[31%] of households report having to choose between paying for food and paying for education for a child or an adult each year” (p. 14). Likewise, the University of Wisconsin-Madison’s Hope Lab released a December 2015 report, Hungry to Learn: Addressing Food and Housing Insecurity among Undergraduates, which concluded that, based on an analysis of 2011 data, “half of all community college students are struggling with food and/or housing insecurity” (Goldrick-Rab, Bolton, & Eisenberg, 2015, p. 2). The authors of that report noted that,
after all grant aid is taken into account, the average dependent student from a family in the lowest income quartile (i.e., $21,000 median annual income) has to pay the equivalent of 40 percent of total family income ($8,300 per year) to attend community college, and an independent student has to devote even more—in fact, the average independent student in this income quartile pays more than his or her total annual income. (Goldrick-Rab et al., 2015, p. 4)
The situation only worsened in subsequent years. Relying on spring 2015 data, the Hope Lab released an update report in January 2016, noting that a majority of students—by then over 60%—reported falling short of the standard of food security as defined by the USDA. A particularly troubling statistic in the report was that “30% of students report[ed] being hungry but unable to eat because of a lack of funds” (Wisconsin Hope Lab, 2016, p. 3). This negative trend was reflected again in the results of a 2016 online survey, administered by the Hope Lab, involving 70 institutions in 24 states. The researchers noted that though the survey was not a “nationally representative sample of students or colleges,” it did represent the largest known survey of basic-needs insecurity—and the results were alarming. The researchers found “substantially higher rates of food insecurity among community college students than previously reported…. Our 2015 report indicated that about half of community college students were food insecure, but this study found that two in three students are food insecure” (Goldrick-Rab et al., 2017, p.1).
Research on campuses nationwide confirms the widespread nature of this problem. Broton and Goldrick-Rab (2016) reported that in a survey of students during their first semester at the University of Wisconsin-Madison, nearly 90% indicated that they worried about not having enough money to pay for all the items necessary to attend college. In response to this anxiety, 71% of the study respondents changed their food-shopping or eating habits. When those same students were surveyed again one year later, 27% reported that in the previous month they had not had enough money to buy food, ate less than they felt they should, or cut the size of their meals, while 7% had recently gone without eating for an entire day (Broton & Goldrick-Rab, 2016). A study in 2011 at Western Oregon University found the prevalence of food insecurity on campus to be even higher, at 59% (Patton- López, López-Cevallos, Cancel-Tirado, & Vazquez, 2014). In 2011, researchers at the City University of New York reported a 39.2% food-insecurity rate among its 250,000 undergraduate students (Freudenberg et al., 2011). Similarly, Eastern, Northern, Southern, and Western Illinois Universities surveyed students across the four campuses and found that 35% reported being food insecure (Morris, Smith, Davis, & Null, 2016). However, despite these campus-specific statistics, only one published report has offered “nationally representative estimates of food insecurity among college students” (Blagg et al., 2017, p. 1), indicating that
levels of food insecurity among households with students in four-year colleges and vocational education were 11.2 and 13.5 percent, respectively, in 2015—rates that are largely similar to national levels. However, households with students enrolled in two-year colleges were more likely to be food insecure in the period after the 2008 recession, with average rates of food insecurity of 21.2 percent during 2008-14. In 2015, the rate of food insecurity among households with two-year college students dropped to an estimated 13.3 percent. (p. 1)
Growing recognition of food insecurity among college students has led to a recent increase in campus food banks. Michigan State University (MSU) (2018) established the first campus food pantry in 1993 and remained the only known campus food pantry for nearly 15 years (CUFBA, 2018), when, in 2008, three other campuses joined MSU. The Michigan State Food Bank and the Oregon State University Food Pantry co-founded the College and University Food Bank Alliance (CUFBA) in 2012 with a mission of “providing support, training and resources to campus-based food banks/pantries and other food insecurity initiatives that primarily serve students.” Since 2008, the number of campus food pantries has grown dramatically (Nellum, 2015): In January 2016, there were 257 active CUFBA member institutions; by October 2017, the number had grown to 559; and as of January 2018, there were 582 registered member campuses (CUFBA, 2018).[1]
The Current Study
Fort Hays State University (FHSU) is a rural state comprehensive university serving students primarily from western Kansas and the surrounding region, as well as international students on campus. (Compared to its on-campus enrollment, FHSU’s combined enrollments of students who take only online courses or courses at our partner university in China are larger; however, these students were not included in the present study.) Though FHSU has the lowest tuition rate within the Kansas Board of Regents system, students with financial need can still find it difficult to secure enough financial aid to cover all of their educational costs. At the undergraduate level, approximately 43% of FHSU students receive some sort of grant or scholarship funding, with an average award of $4,300 (National Center for Education Statistics, 2016). Additionally, 28% of FHSU undergraduate students qualify for an average Pell Grant of $3,800, and 40% borrow federal loans, with an average loan amount of $6,900. While students may pursue other funding opportunities, the latter traditional financial aid awards come up short in covering the full cost of attendance for in-state FHSU students, which on average is approximately $17,000.
Over the past six years, FHSU students and faculty have become increasingly concerned about food insecurity issues on campus. In 2011, the “Victor E. Garden” was created at FHSU to provide all members of the campus community—students, faculty, and staff—greater access to fresh produce, with multiple work/harvest opportunities scheduled each week during the growing season. In 2012, a campus food pantry, known as the Tiger Food Exchange, was created to provide access to food and information about food and hunger issues. A CUFBA member institution, the exchange collects donations of non-perishable foods and basic toiletry/hygiene supplies, and distributes them, along with fresh garden produce during the garden season. A freezer unit in the pantry’s storage room houses donations of farm-fresh beef and other meats as well as frozen fresh produce from the garden, both of which are distributed via a small refrigerator-freezer in the pantry. Grain bins provide an access point for legumes and grains. There is a bookshelf with donated cookbooks and a rack with nutritional and garden information from the local agricultural extension office. The pantry, located in the university library, is accessible to all members of the campus community during library hours.
In 2014, FHSU received a two-year $66,000 Kansas Health Foundation grant to improve the infrastructure and leadership of these programs, facilitate the launch of a “Fresh Food Friday” initiative, provide resources for multiple educational programs related to healthy eating, cooking, and gardening, and support a survey of FHSU students enrolled in on-campus courses. This survey—the centerpiece of the current study—allowed the university to measure levels of food insecurity, as well as the extent to which food-insecure students were using local supports.
Methods
The sample for this study consisted of students who were taking at least one on-campus course during either the spring, summer, or fall 2015 semester and who were not first-year students. First-year students were not included in this research for two reasons. At FHSU all first-year students not living within 60 miles of the campus are required to live in on-campus housing; nearly all students living on campus purchase a meal plan, ensuring seven, 10, or up to 21 meals per week. In addition, because this survey was administered during the fall semester, most first-year students would not have yet been enrolled for one full year, the timeframe over which measures of food insecurity are operationalized.
A total of 3,120 students met the survey criteria, and from the university’s database, researchers drew a simple random sample of 800. A two-wave mail survey was distributed using the university’s most recent “local” address listing for each student. The mailed survey packet contained a cover letter, the survey questionnaire, and a pre-addressed, postage-paid return envelope. The outgoing envelope was printed especially for this survey using the university logo and specifying the sender as “Food and Hunger Initiatives.” The questionnaire was printed in a booklet style and tri-folded; the booklet cover comprised the cover letter from the researchers, signed by the university’s president to help encourage responses. The cover displayed the same university and project branding as the outgoing envelope. Wave 1 occurred just prior to the university’s 2015 fall break, coinciding with the week of Thanksgiving. Wave 2, which targeted non-respondents, occurred during the first week of December, and researchers collected data through the intersession.
Packets sent to 58 targeted respondents were not delivered due to address problems, reducing the total number of eligible respondents to 742. At the end of the two mailing waves, 154 respondents has returned usable questionnaires, yielding a 21% response rate. At a 95% confidence level, the sampling margin of error was +/- 7.7% among the 154 respondents. Comparing demographic characteristics of the final survey sample to the total population of students who met the survey criteria, Table 1 shows that differences tended to be within the survey margin of error for ethnicity, race, and age. The final sample somewhat overrepresented females (66.2% of the sample, 56.3% of the population) and on-campus residents (17.7% of the sample, 7.7% of the population), while underrepresenting sophomores (15.5% of the sample, 24% of the population).
Table 1. Sample Statistics and Population Parameter on Characteristics for Available Population Data
|
Demographic Characteristic |
Value |
Survey Sample (%) |
Study Population (%) (N=3,120) |
|
|
Age |
18 |
< 1 |
< 1 |
|
|
19 |
14.3 |
11.3 |
||
|
20 |
17.5 |
20.5 |
||
|
21 |
16.2 |
20.2 |
||
|
22 |
16.2 |
16.5 |
||
|
23 |
9.7 |
8.9 |
||
|
24 |
7.8 |
6.2 |
||
|
25 |
3.9 |
3.1 |
||
|
26 |
2.6 |
2.4 |
||
|
Older than 26 |
11 |
10 |
||
|
Gender |
Male |
33.8 |
43.7 |
|
|
Female |
66.2 |
56.3 |
||
|
Hispanic Origin |
Yes |
3.9 |
8.6 |
|
|
Racial Identity |
White |
91.7 |
90.3 |
|
|
Black |
3.2 |
2.9 |
||
|
American Indian |
0.6 |
0.4 |
||
|
Asian/Pacific Islander |
4.5 |
6.4 |
||
|
Classification |
Sophomore |
15.5 |
24.0 |
|
|
Junior |
25.4 |
25.2 |
||
|
Senior |
40.1 |
37.0 |
||
|
Graduate Student |
19.0 |
13.7 |
||
|
On-campus resident |
Yes |
17.7 |
7.7 |
|
A composite measure of food insecurity for every respondent was created. The USDA uses 10 items in its composite measure of food insecurity when no children are present in the respondent household, and uses another eight items for households where children are present (USDA, 2015). The USDA requires a respondent to indicate food insecurity (operationalized as responses of “often” or “sometimes,” or a response of “yes”) across three of its items in order to classify the respondent as food insecure. In an effort to ensure consistency with the USDA’s methodology, the questionnaire used in this study included five items that matched the USDA’s (see items in Table 2). Researchers added a sixth item, “Have there been times in the last twelve months when you did not have enough money to buy food that you or your family needed?” Because our research only employed six items to detect food insecurity, we used a tolerance threshold of displaying insecurity on two items in order for the respondent to be classified as food insecure.
Findings
Table 2 shows the six items used in the study for the composite measure, as well as the response distribution for each answer disposition. Boldface figures indicate a disposition of “food insecure” on the individual items. Originally, researchers considered excluding from measures of food insecurity those respondents (n = 6) who lived on campus and had a full meal plan; however, it is possible that during summer sessions, when these students did not have a full-access meal plan, they could have been food insecure. Indeed, one of the six students with a full access meal plan was considered food insecure by measures used to create the composite measure. Students on the full meal plan are able to eat three meals provided by on-campus dining services every day of the week. Students on a seven- or a 10-meal-per-week plan were included in analyses involving the composite measure since these students may have chosen such meal plan options to save money and due to lack of a reliable source of food during parts of the week. That is, they may have been going hungry during parts of every day or even for an entire day(s) of the week.
Table 2. Questions Used to Assess Food Insecurity
|
Survey Question |
Often True (%) |
Sometimes True (%) |
Never True (%) |
||
|
“The food that I/we bought just didn’t last and I/we didn’t have money to get more. Was that [often, sometimes, never true] in the last 12 months?” |
2.5 |
24.7 |
72.8 |
||
|
“We couldn’t afford to eat balanced meals. Was that [often, sometimes, never true] in the last 12 months?” |
11.4 |
28.5 |
60.1 |
||
|
Survey Question |
Yes (%) |
No (%) |
|||
|
“Have there been times in the last twelve months when you did not have enough money to buy food that you or your family needed?” * |
18.4 |
81.6 |
|||
|
“In the last 12 months, did you or other adults in your household ever cut the size of your meals or skip meals because there wasn’t enough money for food?” |
19.7 |
80.3 |
|||
|
“In the last 12 months, did you ever eat less than you felt you should because there wasn’t enough money for food?” |
21.9 |
78.1 |
|||
|
“In the last 12 months, were you ever hungry but didn’t eat because there wasn’t enough money for food?” |
13.3 |
86.7 |
|||
Note. Boldface font indicates disposition considered “food insecure.”
* Unique item designed by authors for use in this survey.
Food Insecurity and Socio-Demographic Correlates
Thirty-four percent (54 of 158) of respondents were food insecure on at least two of the survey question items. Figure 1 illustrates this distribution.
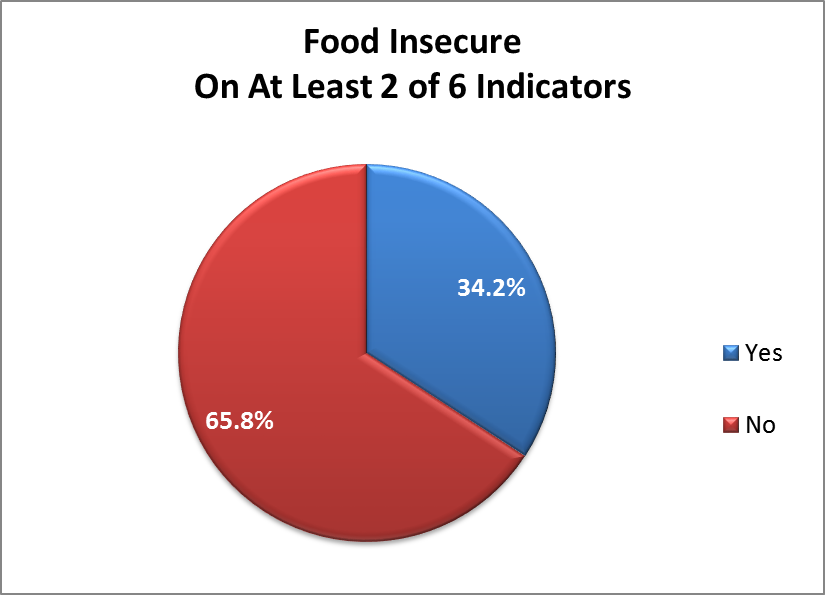
Figure 1. Food insecurity level.
Not surprisingly, bivariate analysis found that the lower the combined income of the student’s current household (i.e., where he/she lived while attending FHSU classes),[2] the more likely the student was to be food-insecure (Pearson’s r = 0.262, sig. = .004). Somewhat surprisingly, additional bivariate analyses (see Appendix 1) found no significant differences in food insecurity relative to the following student characteristics: age, gender, undergraduate/graduate student status, number of credits taken in the most recently completed semester, employment, number of hours per week worked, or status as a dependent of a parent/guardian for tax purposes. Multivariate logistic regression assessing the influence of these variables on food insecurity also found income to be the only significant influence (results available upon request).
A set of items assessed the various sources of funding that respondents used to pay expenses while pursuing their education (including tuition, books, student activity fees, housing, clothing, food, and transportation). The questionnaire offered respondents a set of typical college funding sources, including: savings, parental contributions, scholarships, government grants, a job(s), and student loans. They were asked to estimate the percentage of their total living and education costs covered by each of these sources while enrolled, with the stipulation that after taking all sources into account, the total percentage across all categories could not exceed 100%. An “other” response item was added to account for any funding sources not listed among the response options.
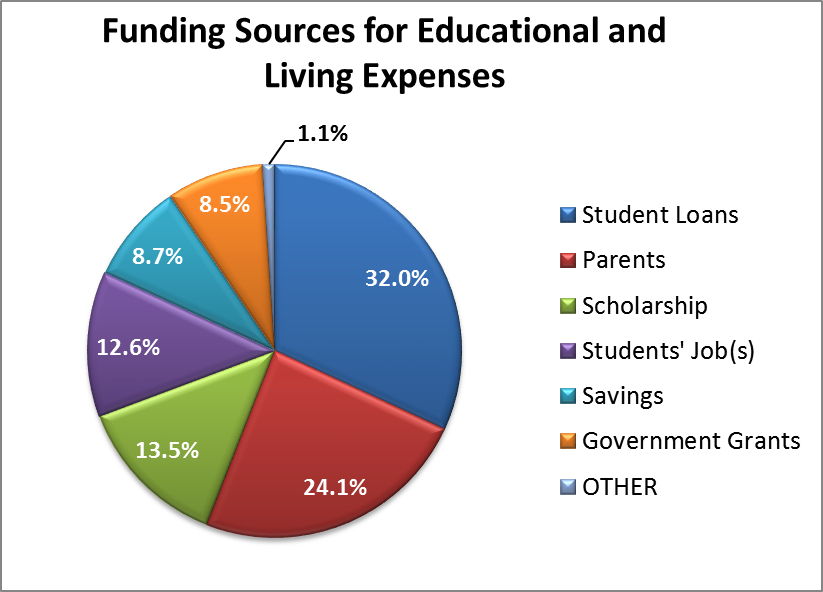
Figure 2. Average relative frequency distribution of educational and living expenses.
The single largest percentage of educational and living costs (32%) were funded by student loans, followed by parents’ contributions (24%), scholarships (13%), job income (13%), savings (9%), government grants (8%), and other sources (about 1% ). In searching for statistically significant relationships between food insecurity and reliance on particular college funding sources, only one source of funding was related in a statistically significant way (see full results in Appendix 1). The bivariate correlation was only slight, and, as might be expected, the higher the percentage of costs funded by savings, the less likely students were to be food-insecure (Pearson’s r = 0.175, sig = 0.036).
Food Insecurity and Use of Local Food Assistance
Figure 3 highlights three statistically significant differences between food-insecure and food-secure students. In addition, Appendix 1 shows the Pearson r correlations. Those who were food-insecure showed a much higher use of free local food-assistance sources than those who were not. Nearly one fifth (18.5%) of those who were food-insecure indicated that someone in their household had used a food pantry in the last year. Food-insecure students used the campus food pantry at a much higher rate. One fourth (24.5%) of those who were food-insecure indicated “yes” when asked whether they had ever accessed the campus food pantry, while only 6.8% of those who were not food-insecure had ever used the campus food pantry. A smaller percentage (27.8%) of food insecure students indicated that they regularly used in their diets fruits or vegetables raised by themselves, their friends, family, or others in the household compared to food-secure students (43.1%).
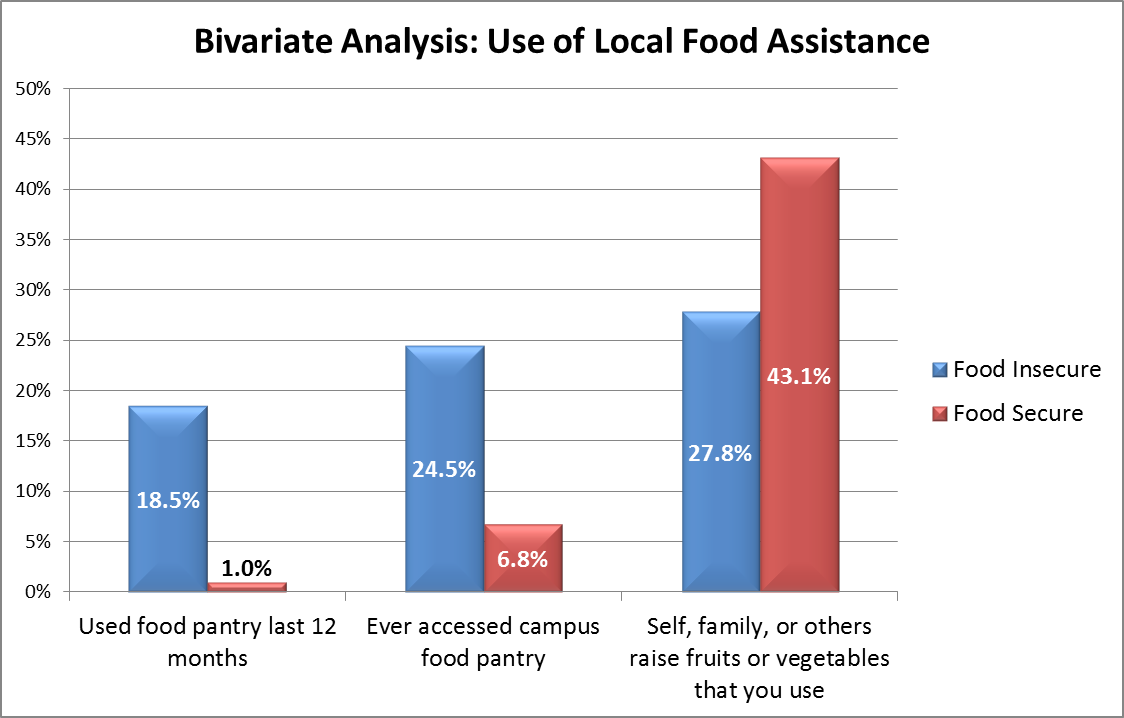
Figure 3. Use of local food assistance by food insecurity status.
Discussion
The USDA has reported a national food insecurity rate of 12.3%, while the food insecurity rate in Kansas from 2014-2016 was approximately 14.5% (USDA, 2018a). Compared to these national and state trends, the food insecurity rate among FHSU students taking on-campus classes is considerably higher, at 34% as of late 2015. As mentioned earlier, this rate is comparable to those found in recent years at other state universities (e.g., 39% among CUNY undergraduate students, 35% at universities in Illinois), though lower than 59% food insecurity rate at Western Oregon University.
FHSU’s cost of attendance, like most public institutions of higher education across the country, has increased every year in recent years. This puts more pressure on students to find ways to paying for school and associated costs. Students may be able to cover rising tuition using scholarships and aid, but many are left with next to nothing to pay for food and housing. There are creative ways that FHSU can address this issue. Universities must explore options for offering affordable on-campus housing and dining to qualified students. National programs such as Swipe Out Hunger and Single Stop operate on college campuses to make available to students the resources and help they need to secure food. These kinds of partnerships are worth pursuing. It is widely accepted that higher education degree completion can break cycles of poverty; yet, if students cannot perform academically because they are forced to choose between paying rent, eating, or paying tuition, then higher education will merely leave these students more in debt and more impoverished than before they started.
It is heartening to note that approximately 25% of FHSU students who show some level of food insecurity use the on-campus food pantry. However, this leaves much room for improvement. The “Fresh Food Fridays” program discussed previously was created at about the time this survey was administered, and the program continues today. The initiative promotes healthy eating by providing students, at no cost, a fresh food item on Fridays on a first-come-first, served basis. It also helps to enhance awareness of the campus food pantry and its location through weekly campus-wide e-mail announcements specifying where the fresh food can be picked up—an awareness we hope will continue to grow.
However, FHSU may need to pursue a more comprehensive approach to the issue of food insecurity among its students than through the food pantry. For instance, the university should explore possibilities with its food services vendor of offering low-cost meal options, as have been developed at Oregon State University (Morgenstern, 2016). Other possibilities worth exploring include creating a student resources position within the student affairs office that connects students to local, state, and federal sources of support. This position could also work on policy reform at the national level to address food insecurity on college campuses. It could also work collaboratively with the existing financial aid office to lobby for FAFSA reform and an increase in state support.
Food insecurity on college campuses is indeed a very real, very pervasive problem that shows no signs of abatement. Students cannot thrive on the stereotyped “Ramen-noodle diet”—and to attempt such should not be treated as a rite-of-passage to degree completion.
References
Bazerghi, C., McKay, F. H., & Dunn, M. (2016). The role of food banks in addressing food insecurity: A systematic review. Journal of Community Health, 41(4), 732-740.
Blagg, K., Whitmore-Schanzenback, D., Gundersen, C., & Ziliak, J. (2017). Assessing food insecurity on campus. Retrieved from https://www.urban.org/research/publication/
assessing-food-insecurity-campus
Broton, K., & Goldrick-Rab, S. (2016). The dark side of college (un)affordability: Food and housing insecurity in higher education. Change, 48(1), 16-25.
College and University Food Bank Alliance. (2017). CUFBA to join Temple University HOPE Center. Retrieved from https://sites.temple.edu/cufba/2017/07/17/cufba-to-join-temple-university-hope-center/
College and University Food Bank Alliance. (2018). About us. Retrieved from https://sites.temple.edu/cufba/about-us/
College Board. (2017). Trends in student aid 2017. Retrieved from https://trends.collegeboard.org/sites/default/files/2017-trends-student-aid_0.pdf
Duke-Benfield, A.E. (2015). Bolstering non-traditional student success: A comprehensive student aid system using financial aid, public benefits, and refundable tax credits. Retrieved from https://trends.collegeboard.org/sites/default/files/2017-trends-student-aid_0.pdf
Feeding America. (2014). Hunger in America 2014: Executive summary. Retrieved from http://help.feedingamerica.org/HungerInAmerica/hunger-in-america-2014-summary.pdf
Freudenberg, N., Manzo, L., Jones, H., Kwan, A., Tsui, E., & Gagnon, M. (2011). Food insecurity at CUNY: Results from a survey of CUNY undergraduate students. Retrieved from http://www.gc.cuny.edu/CUNY_GC/media/CUNY-Graduate-Center/PDF/Centers/Center%20for%20Human%20Environments/cunyfoodinsecurity.pdf
Goldrick-Rab, S. (2018). It’s hard to study if you’re hungry. New York Times. Retrieved from https://www.nytimes.com/2018/01/14/opinion/hunger-college-food-insecurity.html
Goldrick-Rab, S., Broton, K., & Eisenberg, D. (2015). Hungry to learn: Addressing food and housing insecurity among undergraduates. Retrieved from http://wihopelab.com/publications/Wisconsin_hope_lab_hungry_to_learn.pdf
Goldrick-Rab, S., Richardson, J., & Hernandez, A. (2017). Hungry and homeless in college: Results from a national study of basic needs insecurity in higher education. Retrieved from http://www.wihopelab.com/publications/Hungry-and-Homeless-in-College-Report.pdf
Krishnamurthy, M. (2018). Community colleges combat hunger through campus food pantries. Chicago Daily Herald. Retrieved from http://www.dailyherald.com/news/20180303/
community-colleges-combat-hunger-through-campus-food-pantries
Morgenstern, M. (2016). Students shouldn’t have to choose between books and food. Chronicle of Higher Education. Retrieved from https://www.chronicle.com/article/Students-Shouldn-t-Have-to/235519
Morris, L. M., Smith, S., Davis, J., & Null, D. B. (2016). The prevalence of food security and insecurity among Illinois University students. Journal of Nutrition Education and Behavior, 48(6), 376-382.
National Center for Education Statistics. (2016). Fort Hays State University [IPEDS data summary]. Retrieved from https://nces.ed.gov/collegenavigator/?q=
fort+hays+state&s=all&id=155061
Nellum, C. (2015). Fighting food insecurity on campus. Higher Education Today. Retrieved from http://higheredtoday.org/2015/06/29/fighting-food-insecurity-on-campus/
New, J. (2015). After recession and recovery, students report they remain “financially stressed.” Inside Higher Ed. Retrieved from https://www.insidehighered.com/news/2015/11/19/
after-recession-and-recovery-students-report-they-remain-financially-stressed
Patton-López, M., López-Cevallos, D., Cancel-Tirado, D.I., Vazques, L. (2014). Prevalence and correlates of food insecurity among students attending a midsize rural university in Oregon. Journal of Nutrition Education and Behavior, 46(3), 209-214. Retrieved from http://ir.library.oregonstate.edu/xmlui/bitstream/handle/1957/45177/PattonLopez_JNEB_foodinsecurity_11414.pdf?sequence=1
Smola, J. (2018). Ohio colleges see rise in food insecurity on campus. Columbus Dispatch. Retrieved from http://www.dispatch.com/news/20180212/ohio-colleges-see-rise-in-food-insecurity-on-campus
U.S. Department of Agriculture. (2015). Household food security in the United States in 2014 (Economic research report no. 194). Washington, DC: Economic Research Service.
U.S. Department of Agriculture. (2018a). Key statistics and graphics. Retrieved from https://www.ers.usda.gov/topics/food-nutrition-assistance/food-security-in-the-us/key-statistics-graphics.aspx
U.S. Department of Agriculture. (2018b.) Ranges of food security and food insecurity. Retrieved from http://www.ers.usda.gov/topics/food-nutrition-assistance/food-security-in-the-us/definitions-of-food-security.aspx
Wisconsin Hope Lab. (2016). What we’re learning: Food and housing insecurity among college students a data update from the Wisconsin Hope Lab (Data brief 16-01). Retrieved http://www.wihopelab.com/publications/Wisconsin_HOPE_Lab_Data%20Brief%2016-01_Undergraduate_Housing%20and_Food_Insecurity.pdf
Appendix 1: Pearson r Bivariate Correlations
(For all tables, associations in bold are significant at 0.05 level or better – two-tailed.)
Food Insecurity Status by Sociodemographic Characteristics
|
1 Food insecure 1=yes 2=no |
2 Combined HH income where lives while studenta. |
2 Age |
3 Gender 1=male 2=female |
4 Student status 1=undergrad 2=grad |
5 Credits completed last semester |
6 Employment status 1=employed 2=not |
7 Hours worked per week |
8 Parents claim as dependent 1=yes 2=no |
||
|
1 |
r Sig N |
1 |
.262 .004 120 |
.015 .856 154 |
-.007 .936 157 |
-.023 .777 150 |
.045 .586 150 |
.127 .113 157 |
.071 .430 125 |
.006 .945 149 |
|
2 |
r Sig N |
1 |
.402 .000 116 |
-.143 .120 119 |
.248 .008 113 |
-.236 .011 115 |
.070 .452 119 |
.535 .000 101 |
.242 .010 113 |
|
|
3 |
r Sig N |
1 |
-.179 .027 154 |
.368 .000 148 |
-.470 .000 146 |
-.116 .152 153 |
.325 .000 121 |
.496 .000 145 |
||
|
4 |
r Sig N |
1 |
-.103 .208 150 |
.169 .040 149 |
-.045 .578 156 |
-.055 .546 124 |
-.123 .137 148 |
|||
|
5 |
r Sig N |
1 |
-.545 .000 143 |
-.025 .763 150 |
-.097 .295 119 |
.403 .000 141 |
||||
|
6 |
r Sig N |
1 |
-.002 .985 150 |
-.098 .285 120 |
-.290 .000 141 |
|||||
|
7 |
r Sig N |
1 |
n/a |
-.040 .630 148 |
||||||
|
8 |
r Sig N |
1 |
.252 .006 118 |
|||||||
|
r Sig N |
1 |
a Combined total household income was measured by asking, “Thinking only of yourself and any adults currently living with you, what is the approximate yearly combined gross income (total income before taxes) of the household? Include only yourself and household members with whom you share income and expenses.” The following income category choices were offered, and the percent who fall into each category is presented in parentheses: “1. Under $15,000 (70.8%),” “2. $15,000-$25,999 (10.0%),” “3. $26,000-$50,999 (8.3%),” “4. $51,000-$75,999 (5.0%),” “5. $76,000-$100,000 (3.3%),” “6. Over $100,000 (2.5%).”
Food Insecurity Status by Percent of College Expenses Funding by Source
|
1 Food insecure 1=yes 2=no |
2 Percent funded by savings |
3 Percent funded by parents |
4 Percent funded by scholarships |
5 Percent funded by gov’t grants |
6 Percent funded by job(s) |
7 Percent funded by loans |
||
|
1 |
r Sig N |
1 |
.175 .036 143 |
.077 .359 143 |
-.049 .563 143 |
-.008 .925 143 |
-.117 .166 143 |
-.030 .721 143 |
|
2 |
r Sig N |
1 |
-.011 .898 143 |
-.103 .223 143 |
-.144 .086 143 |
.024 .776 143 |
-.273 .001 143 |
|
|
3 |
r Sig N |
1 |
-.150 .074 143 |
-.202 .016 143 |
-.296 .000 143 |
-.472 .000 143 |
||
|
4 |
r Sig N |
1 |
-.049 .563 143 |
-.099 .238 143 |
-.347 .000 143 |
|||
|
5 |
r Sig N |
1 |
-.001 .993 143 |
-.219 .009 143 |
||||
|
6 |
r Sig N |
1 |
-.257 .002 143 |
|||||
|
7 |
r Sig N |
1 |
Food Insecurity Status by Use of Local Food Supports
|
1 Food insecure 1=yes 2=no |
2 Someone in HH used food pantry last 12 mo 1=yes 2=no |
3 Ever accessed campus food pantry 1=yes 2=no |
4 Friends, family, or others in HH raise fruties or veg that I use 1=yes 2=no |
5 Ever accessed fruits or veg from campus community garden 1=yes 2=no |
||
|
1 |
r Sig N |
1 |
.327 .000 158 |
.251 .002 156 |
-.151 .060 156 |
.176 .030 152 |
|
2 |
r Sig N |
1 |
.643 .000 156 |
-.060 .458 156 |
.575 .000 152 |
|
|
3 |
r Sig N |
1 |
-.024 .764 155 |
.562 .000 152 |
||
|
4 |
r Sig N |
1 |
.035 .672 151 |
|||
|
5 |
r Sig N |
1 |
Author Biographies
Dr. Brett Zollinger is Professor of Sociology and Sociology Department Chair at Fort Hays State University. He also serves the Docking Institute of  Public Affairs at FHSU as a Senior Policy Fellow, and is a past Director of the Institute. He teaches Community Theory and Development, Rural and Urban Sociology, Sociological Theory, and Applied Sociology. He has published in the academic journals: eJournal of Public Affairs, Rural Sociology, Journal of the Community Development Society, Research in Community Sociology, Economic Development Quarterly, Complimentary Health Practice Review, and the Online Journal of Rural Research and Policy. He also has a book chapter in the edited book, Mad About Wildlife
Shala Mills, Assistant Vice President for Graduate and Extended Learning at State University of New York at New Patlz, was formerly Chair and  Professor of Political Science at Fort Hays State University (Kansas). She is the recipient of numerous teaching and advising awards. She has taught courses in the areas of law and the courts, current political issues, sustainability, food and politics, and global challenges. She served as one of the AASCU Global Engagement Scholars, was the National Coordinator for the AASCU Global Challenges Project, and was the 2017 recipient of AASCU’s Barbara Burch Award for Faculty Leadership in Civic Engagement. She sponsored FHSU’s Food and Hunger Initiatives, serving on the faculty team that secured a Kansas Health Foundation grant to build a strong infrastructure for the campus food pantry and community garden. Her most recent publications have been in the areas of academic assessment and leadership and global challenges.
Emily Brandt is a senior majoring in Political Science with a minor in Philosophy and a certificate in Leadership Studies. Emily is from Beloit, Kansas. She has been a part of the Student Government Association since January of 2015, serving as senator for the College of Arts and Sciences; she was the Vice Chair of the Appropriations Committee before becoming the Chair of the Appropriations Committee, and the College of Arts and Sciences Majority Leader. During the 2015-2016 academic year, Emily also chaired the Public Safety and Awareness Committee. At semester, she was hired onto the executive staff as the Legislative Affairs Director for Spring 2016. Emily has a passion for civic engagement, student advocacy, politics, staying up to date on current issues, and getting involved on campus.
Wendy Rohleder-Sook is the Director of Financial Assistance at Fort Hays State University. Her professional career in higher education has a lso included serving as the Associate Dean for Student Affairs at the University of Kansas School of Law and the Assistant Director/Pre-Law Coordinator in the Freshman-Sophomore Advising Center at the University of Kansas. She is a member of the National Association of Student Financial Aid Administrators (NASFAA,) Rocky Mountain Association of Student Financial aid Administrators (RMASFAA,) and Kansas Association of Student Financial Aid Administrators.
Footnotes
-
CUFBA will soon join the new HOPE Center at Temple University, which will open under the leadership of Sara Goldrick-Rab, who founded the Wisconsin HOPE Lab (CUFBA, 2017). ↑
-
Combined total household income was measured by asking, “Thinking only of yourself and any adults currently living with you, what is the approximate yearly combined gross income (total income before taxes) of the household? Include only yourself and household members with whom you share income and expenses.” The following income category choices were offered, and the percent who fell into each category was presented in parentheses: “1. Under $15,000 (70.8%),” “2. $15,000-$25,999 (10.0%),” “3. $26,000-$50,999 (8.3%),” “4. $51,000-$75,999 (5.0%),” “5. $76,000-$100,000 (3.3%),” “6. Over $100,000 (2.5%).” ↑